Google PageSpeed Insights: How to Test and Improve Your Website


A slow website can lose a visitor before they reach your services, products or contact form. But a low PageSpeed score does not tell you everything about that experience, and a high score does not prove every visitor has a smooth journey.
Google PageSpeed Insights helps you investigate both. The useful part is understanding what the report measures, identifying the problem that affects visitors, and checking whether your changes actually improve it.
What Google PageSpeed Insights Shows You
Google PageSpeed Insights is a free tool for testing individual web pages on mobile and desktop. Its report combines two different views: measurements from real visitors, where available, and a simulated page-load test powered by Lighthouse.
Field data comes from the Chrome User Experience Report, or CrUX. It reflects eligible Chrome users’ experiences over a rolling 28-day period. This is where you check how visitors have actually experienced the page.
Lab data comes from a controlled Lighthouse test. It helps you investigate issues such as a slow main image, scripts that keep the browser busy, or content that shifts while loading. Because it represents one simulated visit, it can differ from the field results.
Check whether the real-user section shows data for This URL or Origin. Origin data combines experiences across pages on the same origin, such as your HTTPS website, rather than isolating the page you entered. Google’s explanation of PageSpeed Insights data covers this distinction.
If there is insufficient field data, you can still use the lab test. An unavailable real-user assessment means there is not enough qualifying data, rather than an automatic performance failure.

How to Run a Useful PageSpeed Test
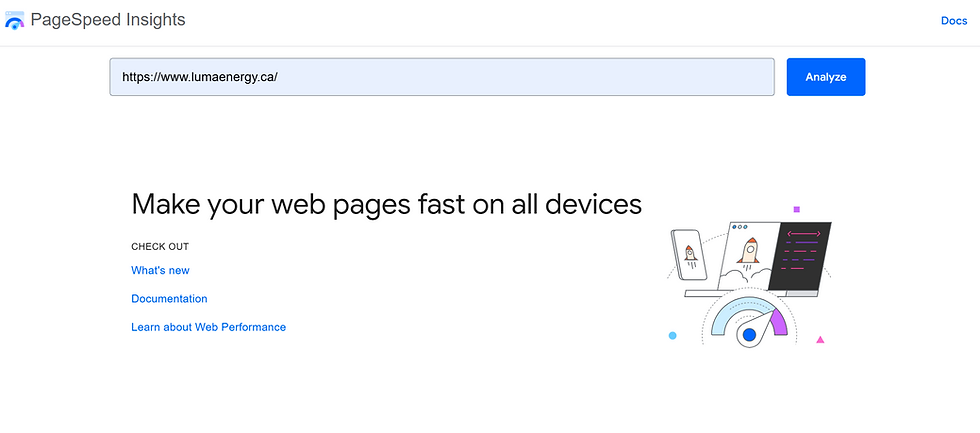
Start with pages that matter to your business: the homepage, an important service page, a product page and a page used in advertising. Different templates can have different problems, so one homepage test cannot represent the entire website.
Enter the published URL, run the analysis, and review both device tabs. Mobile deserves particular attention because a page that works comfortably on a desktop can struggle under more demanding mobile test conditions.
Record the page, device type, test date, Core Web Vitals results and main diagnostic findings. Repeat the lab test a few times to check whether the same problem appears consistently. Changing advertisements, third-party scripts and testing conditions can produce different results between runs.
Then try the page yourself on a phone. Open the menu, use the form, change product options and dismiss any pop-ups. A loading test can reveal useful problems, but it does not replace checking the actions visitors need to complete.
Understand Core Web Vitals and the Performance Score
Core Web Vitals measure loading, responsiveness and visual stability. The current metrics are Largest Contentful Paint, Interaction to Next Paint and Cumulative Layout Shift. INP replaced First Input Delay in March 2024, so FID should no longer appear as a current target in your optimization plan.
Google’s Core Web Vitals guidance sets these thresholds for a good experience:
Metric | What it measures | Good threshold |
Largest Contentful Paint (LCP) | When the largest visible content element renders | 2.5 seconds or less |
Interaction to Next Paint (INP) | How quickly the page visually responds to interactions | 200 milliseconds or less |
Cumulative Layout Shift (CLS) | Unexpected movement of page content | 0.1 or less |
The field assessment uses the 75th percentile, rather than the average. A good result means at least 75% of the recorded experiences meet that metric’s good threshold. Aim to meet all three targets where sufficient data is available.
The 0–100 Performance score belongs to the Lighthouse lab test. Google classifies 90–100 as good, 50–89 as needing improvement and 0–49 as poor. It is a separate result from the real-user Core Web Vitals assessment.

For a real example, our mobile test of the LumaEnergy homepage returned a Performance score of 36 and a lab LCP of 17.1 seconds. Real-user data was unavailable in this report. These results point to a loading problem under the simulated conditions, giving us a reason to investigate without assuming every visitor experiences the same delay.
Choose Fixes That Address the Actual Problem
Expand the report’s Insights and Diagnostics to identify which resources or behaviours are responsible. Recent Lighthouse versions have replaced many older audit names with performance insights, so older tutorials may show labels you no longer see.
Treat each finding as evidence to investigate. Estimated savings from different recommendations can overlap, and removing a flagged resource without understanding its purpose can break a working feature.
Improve LCP by Finding What Loads Late
Identify the element responsible for LCP before changing the page. If it is a hero image, check its dimensions, delivery format and loading priority. If it is text, investigate whether fonts or other resources delay its appearance.
An oversized image may need resizing and compression, but a smaller file alone will not fix an image that starts loading late. Google’s practical Core Web Vitals recommendations advise making the LCP resource available early and avoiding lazy loading for the LCP image. Lazy loading is better suited to less urgent content further down the page.
Our guide to optimizing website images explains image choices in more detail. If the delay starts before the browser receives the page, investigate server response and caching instead.
Improve INP by Reducing Work During Interactions
A page can load quickly and still respond slowly when someone opens a menu or uses a filter. Investigate the scripts and browser work happening around the delayed interaction, including chat widgets, tracking tools and custom features.
Removing unnecessary scripts can help, while heavier features may need a developer to split long tasks into smaller pieces. Minifying JavaScript reduces file size, but does not automatically solve slow interaction handling.
Lighthouse’s Total Blocking Time can flag loading-related responsiveness problems. However, Google’s INP documentation explains why a standard Lighthouse navigation test cannot directly measure INP without user interaction. Check real-user data and test the affected action as well.
Improve CLS by Keeping Space for Content
Watch for images, embeds, banners or fonts that move content after it appears. Reserving space for an image or video allows the browser to maintain the layout while that content loads.
For example, a booking widget inserted above a contact form can push the form down just as someone starts using it. Give the widget a predictable space and test its loaded and loading states. Check font changes too, particularly when headings wrap differently after the chosen font arrives.
What Wix Website Owners Can Control
Wix already provides infrastructure such as a CDN, caching and automatic image optimization, as described in its site performance documentation. Recommendations to install a caching plugin or switch hosting providers are therefore a poor starting point for a Wix site.
Focus on your page design, media, apps, external embeds and custom code. Review whether a large background video is necessary, whether an unused app remains installed, and whether every tracking script needs to load across the entire site.
Some JavaScript belongs to the platform and supports essential functions. Identify what you control before removing anything, then verify that navigation, forms, bookings and checkout still work after changes.
Retest and Track the Results
After publishing a change, rerun the same URLs using the same device tabs. Compare the affected metric and diagnostic finding, rather than relying only on the overall score. Also repeat the visitor actions that matter to the page.
Lab tests can reflect improvements immediately. Field data updates over a rolling 28-day window, so older visits remain in the results while newer experiences accumulate. You do not need to wait 28 days before looking for a trend, but the full effect may take time to appear.
Google Search Console’s Core Web Vitals report can help you track groups of pages with similar issues. Review performance again after significant changes, such as installing an app, redesigning a template or adding an embedded tool.
How PageSpeed Fits Into SEO
Google confirms that Core Web Vitals are used by its ranking systems, but its page experience guidance also makes clear that good scores do not guarantee top rankings. A perfect Lighthouse score is not a substitute for useful content, relevant services or a website visitors can navigate easily.
Use PageSpeed Insights to remove measurable obstacles to using your website. If you need help identifying the cause and implementing the changes, CodeMasters’ website development services can support that work.
Choose Fixes That Address the Actual Problem
Expand the report’s Insights and Diagnostics to identify which resources or behaviours are responsible. Recent Lighthouse versions have replaced many older audit names with performance insights, so older tutorials may show labels you no longer see.
Treat each finding as evidence to investigate. Estimated savings from different recommendations can overlap, and removing a flagged resource without understanding its purpose can break a working feature.
Improve LCP by Finding What Loads Late
Identify the element responsible for LCP before changing the page. If it is a hero image, check its dimensions, delivery format and loading priority. If it is text, investigate whether fonts or other resources delay its appearance.
An oversized image may need resizing and compression, but a smaller file alone will not fix an image that starts loading late. Google’s practical Core Web Vitals recommendations advise making the LCP resource available early and avoiding lazy loading for the LCP image. Lazy loading is better suited to less urgent content further down the page.
Our guide to optimizing website images explains image choices in more detail. If the delay starts before the browser receives the page, investigate server response and caching instead.
Improve INP by Reducing Work During Interactions
A page can load quickly and still respond slowly when someone opens a menu or uses a filter. Investigate the scripts and browser work happening around the delayed interaction, including chat widgets, tracking tools and custom features.
Removing unnecessary scripts can help, while heavier features may need a developer to split long tasks into smaller pieces. Minifying JavaScript reduces file size, but does not automatically solve slow interaction handling.
Lighthouse’s Total Blocking Time can flag loading-
related responsiveness problems. However, Google’s INP documentation explains why a standard Lighthouse navigation test cannot directly measure INP without user interaction. Check real-user data and test the affected action as well.
Improve CLS by Keeping Space for Content
Watch for images, embeds, banners or fonts that move content after it appears. Reserving space for an image or video allows the browser to maintain the layout while that content loads.
For example, a booking widget inserted above a contact form can push the form down just as someone starts using it. Give the widget a predictable space and test its loaded and loading states. Check font changes too, particularly when headings wrap differently after the chosen font arrives.
What Wix Website Owners Can Control
Wix already provides infrastructure such as a CDN, caching and automatic image optimization, as described in its site performance documentation. Recommendations to install a caching plugin or switch hosting providers are therefore a poor starting point for a Wix site.
Focus on your page design, media, apps, external embeds and custom code. Review whether a large background video is necessary, whether an unused app remains installed, and whether every tracking script needs to load across the entire site.
Some JavaScript belongs to the platform and supports essential functions. Identify what you control before removing anything, then verify that navigation, forms, bookings and checkout still work after changes.
Retest and Track the Results
After publishing a change, rerun the same URLs using the same device tabs. Compare the affected metric and diagnostic finding, rather than relying only on the overall score. Also repeat the visitor actions that matter to the page.
Lab tests can reflect improvements immediately. Field data updates over a rolling 28-day window, so older visits remain in the results while newer experiences accumulate. You do not need to wait 28 days before looking for a trend, but the full effect may take time to appear.
Google Search Console’s Core Web Vitals report can help you track groups of pages with similar issues. Review performance again after significant changes, such as installing an app, redesigning a template or adding an embedded tool.
How PageSpeed Fits Into SEO
Google confirms that Core Web Vitals are used by its ranking systems, but its page experience guidance also makes clear that good scores do not guarantee top rankings. A perfect Lighthouse score is not a substitute for useful content, relevant services or a website visitors can navigate easily.
Use PageSpeed Insights to remove measurable obstacles to using your website. If you need help identifying the cause and implementing the changes, CodeMasters’ website development services can support that work.
FAQ: Google PageSpeed Insights
Is Google PageSpeed Insights free?
Yes. Google PageSpeed Insights is free and does not require an account. Enter a page’s URL to review its mobile and desktop performance reports.
Why is my mobile PageSpeed score lower than desktop?
The mobile test simulates more demanding device and network conditions. Large images, heavy scripts and complex layouts can have a greater impact under those conditions.
Why does my PageSpeed Insights score change between tests?
Testing conditions, server responses and third-party content can vary between runs. Compare several tests and recurring issues before treating a small score change as meaningful.
Can a website pass Core Web Vitals with a low PageSpeed score?
Yes. Core Web Vitals use real visitor data, while the Performance score comes from a simulated Lighthouse test. The two results measure different conditions and can disagree.


